Time travel
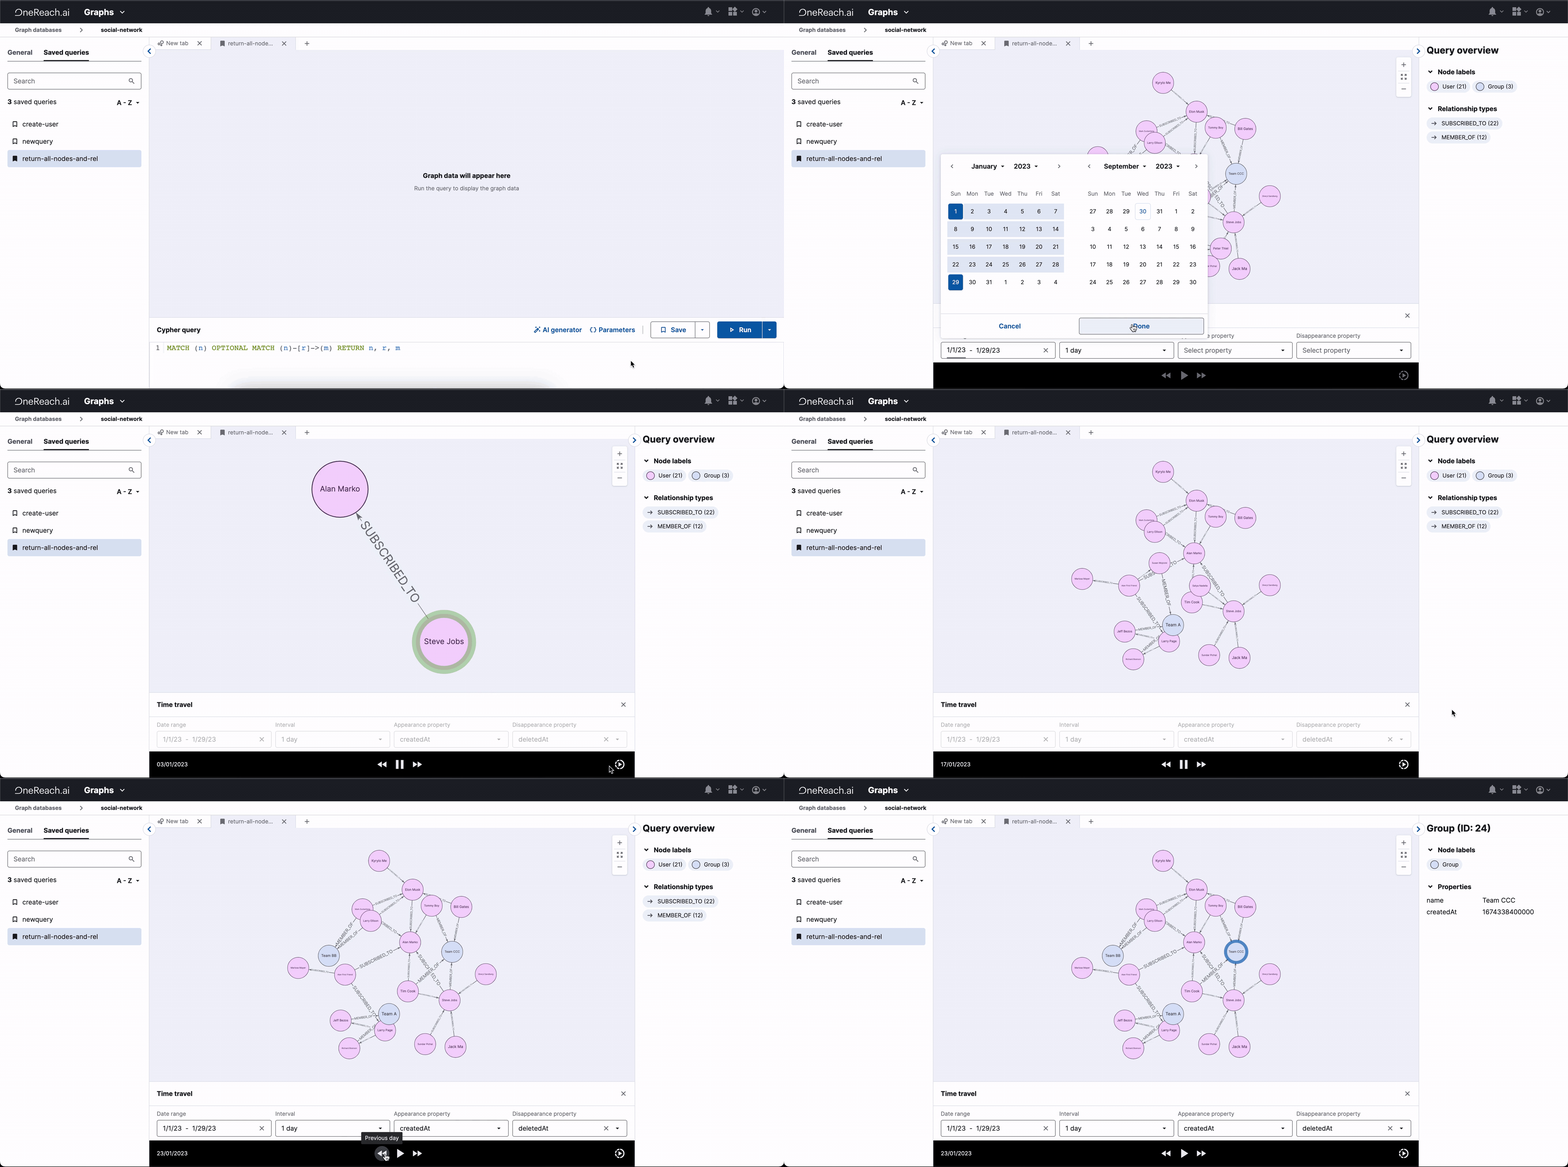
Time travel in a Graph database provides a unique opportunity to interact with your data in a temporally influenced manner. It allows for exploring changes to any specific set of data over an identified timeline, either retrospectively or predictively. With this functionality, you can visualize and analyze how your data structure evolves, showcasing the effects of certain actions, decisions, or events on the data. It is, indeed, akin to journeying back or forth in time.
How to use
- Create a query with the data you want to explore
- Run the query using the Run in Time travel button
- Adjust the time travel conditions:
Date range: allows you to narrow down the specific duration for analysis. It may be particular days, weeks, or months. Essentially, you can visualize data transformations for any chosen period.
Interval: determine how frequently you want to observe changes in the data over the defined date range. It could be hourly, daily, weekly, or monthly, providing insights into emerging trends and patterns in your data over time.
Properties: decide what specific data or aspect you want to see change over time. You can select any property that is stored in your database. There are two types of properties:
Type 1: Appearance property
- This is a mandatory field that determines when to display the node on the Graph tree
- The field must be represented in a millisecond format (timestamp)
- For example, if the current time was recorded as "1693385535209", it means that the node will be displayed at this specified point in time
Type 2: Disappearance property
- This is an optional field that determines when the node should be hidden on the Graph tree.
- This field should also be represented in a millisecond format (timestamp).
- If this property is set, the node will be hidden at the specified time. If the property is not set, the node will remain visible.
The time travel feature in the Graph databases provides a dynamic data analysis viewpoint, showcasing how data evolves. It aids in comprehensive data understanding, generating action-oriented insights and driving informed decision-making.
Example of Time travel
